While evaluating SAN storage solutions for our VMWare environment, we found ourselves asking the question “How many systems can we fit on this system before IOPs and/or throughput become a bottleneck?” Come to find out, the answer is not a simple one. In fact, all of the vendors we posed this question to were only able to give us vauge performance numbers based on perfect conditions. We set out on a quest to quantify the capacity of each of the backend storage systems we tested.
Generally speaking IOPs is inversely proportional to the request size while throughput is proportional. This means that as the request size descreases the total number of IOPs increases while throughput decreases and vice versa. So when you see performance numbers that claim very high IOPs those are based on small requests and therefore throughput will be very minimal. In additional, disk latency and rotational speed can play a role in skewing these numbers as well. Sequential operations will produce much higher numbers than random operations. When we add RAID to the equation, we will see a difference in numbers depending upon whether the operation is a read or a write.
What does all this mean? It means that the performance capacity of a disk or storage device is determined by 3 main factors: Request Size, Random/Sequential operation, and Read/Write operation. There are other factors that can play a role, but focusing on these three factores will provide an estimation of the capacity of a disk, array or storage system. There are differing opinions as to what these numbers are in “real life.” The generally accepted view is that the average request size is 32K, 60% of transactions are random while 40% are sequential, and 65% are reads while 35% are writes. However, these numbers differ depending upon the application. The best way to determine these numbers for your environment is to capture statistics from production systems and average them together.
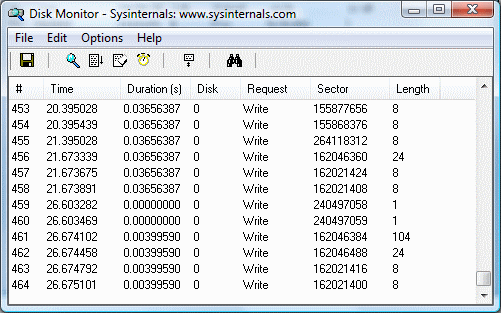
Fortunately, there is a nice utility for Windows that will allow you to get this information. The Diskmon utility: http://technet.microsoft.com/en-us/sysinternals/bb896646.aspx available from SysInternals (now part of Microsoft), will log every disk transaction with the necessary information.

Diskmon will begin capturing data immediately. To stop Diskmon from capturing data, click the magnifying glass in the toolbar:

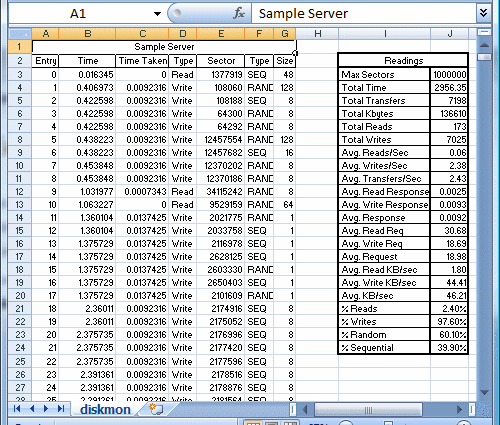
You can then save the output to a text file by clicking the save button. I recommend capturing data during normal usage over a reasonable period of time. Also, it is best to minimize the Diskmon window to keep CPU usage to a minimum. The next step is to import the text file into Excel. I have provided a sample excel spreadsheet you can use as a template to perform the necessary calculations: server_diskmon.

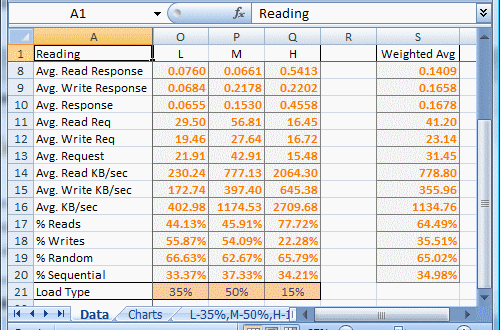
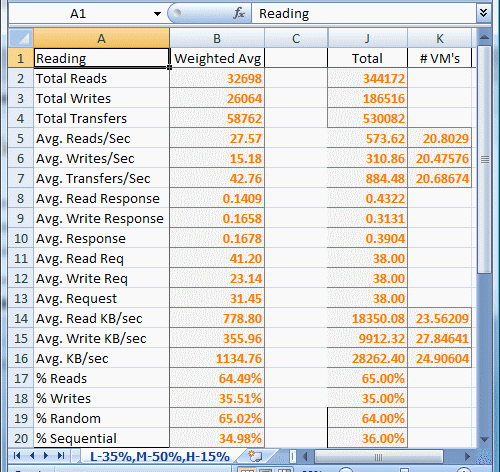
By taking a sampling from various systems on our network and using a weighted average, we calculated average of usage on our systems. In our case, we were using a common storage backend, and we wanted to categorize different systems into low (L), medium (M), and high (H) usage systems. We then assigned a percentage to each. By doing this, we can calculate the disk usage on the system if x% are low usage, y% medium usage, and z% high usage.

We now have an accurate estimation of the Read Request Size, Random/Sequential percentages, and Read/Write percentages. If we feed these numbers into IOMeter, we can get a baseline of what the backend storage system can support. Divide that by our weighted average and we can find exactly how many systems our backend can support. If we look at point in time numbers, we can figure out the percentage of disk capacity being used:

I have put together a sample IOMeter configuration file containing the “real life” specification of 32K requests, 60% Random / 40% Sequential, and 65% Reads / 35% Writes.
Also, there’s a great comparison of SAN backends for VMWare environments here: http://communities.vmware.com/message/584154. Users have run the same real life test against their backend storage systems which will allow you to compare your devices performance with other vendors.
One side note when using IOMeter, be sure to set your disk size to something greater than the amount of cache in your backend storage systems in order to calculate raw disk performance. The configuration file I have provided uses a 8GB test file which should suffice for most installations.