Correcting SFC (System File Checker) errors

We recently began using Microsoft’s built-in SFC (System File Checker) as part of our FIM (File Integrity Monitoring) solution for PCI (Payment Card Industry) compliance. This great feature will compute hashes of core system files and compare those against originals looking for differences. If any are found, it can automatically replace those files with the original. The best part is that it incorporates all system updates into these checks so you can rest easy knowing that the checks are being performed against the latest, patched system files.

In most cases, this runs without intervention, but every now and then it needs a little help correcting any problems it encounters. If running a scan (via sfc /scannow) indicates there were unfixable errors found (eg. “Windows Resource Protection found corrupt files but was unable to fix some of them.”), you can use the log file under C:\Windows\Logs\CBS\CBS.log to determine which file(s) are having problems being fixed. Microsoft’s KB928228 article has great instructions on how to analyze this file. The basic gist is to run the following command and view the details only:

findstr /c:”[SR]” %windir%\logs\cbs\cbs.log >sfcdetails.txt

Search the resulting file for the phrase “cannot repair” – this should give you the file(s) that SFC is having problems replacing. To fix this, replace these file(s) manually with trusted versions (either from source media or from other working systems with same edition, bitness, and patch-level). It is probably best to review the text in the CBS.log file surrounding that entry to be certain you are replacing with the appropriate versions.

In very rare cases, you may not find the phrase “cannot repair” in the log file. In fact, you will find an entry to the contrary: “Verify and Repair Transaction completed. All files and registry keys listed in this transaction have been successfully repaired” at the end of the log file, but the SFC program will still still report that it found unfixable files. In these cases, I have found that renaming the file(s) specified in the logs and re-running SFC will correct the issue. You may need to take ownership, change permissions, or boot into safe mode to rename the suspect file(s) depending upon the system file in question.

Configure source ip for Nessus daemon on Windows

Nessus from Tenable Network Security is an invaluable tool for vulnerability scanning. As a windows-only shop, we were very pleased that Nessus would run on a Windows platform. For our configuration, we have a server sitting outside of our firewall with multiple public IP addresses. We configured firewall policies for the system’s primary IP address to allow it necessary access into our environment and from our management subnet to the device. That means we needed a different IP address to use for scanning so it can be subject to the standard rules that apply to all external traffic.

In *nix environments, the Nessus daemon has a command line switch that forces the scanner to use a specific source IP for scans (this is different than the “listen address” which is used by remote clients to connect to the scanner – that setting can be configured in nessusd.conf). Unfortunately, the nessus-service.exe called by the Windows Service does not pass command line parameters to the nessusd process.

Not to worry, our old friend srvany comes to the rescue (note that srvany only works on Windows 2000/2003/XP). Perform the following steps:

  1. Stop the Nessus service
  2. Copy the srvany.exe executable to C:\Program Files\Tenable\Nessus
  3. Modify the ImageName value under HKLM\SYSTEM\CurrentControlSet\Services\Tenable Nessus to C:\Program Files\Tenable\Nessus\srvany.exe
  4. Add a Parameters key under HKLM\SYSTEM\CurrentControlSet\Services\Tenable Nessus
  5. Add a REG_SZ value named Application with the following value (replace <ip_address> with the IP you want the scanner to use for scans):
    C:\Program Files\Tenable\Nessus\nessusd.exe -S <ip_address>
  6. Start the Nessus service.

Happy scanning!

Sound Blaster Wireless Music Device

It’s been quite some time since this device was released.

Sound Blaster Wireless Music

I picked one up back in 2003 and it has been a little work-horse ever since. I love the fact it comes with a remote with a screen that you can use to flip through albums and songs. Unfortunately, it was discontinued before it’s time. Information is scarce out there about it, but here’s a couple of tricks in case you still have yours or pick up a used one on ebay.

First, upgrade to the latest firmware. This is an unreleased version that was posted by a Creative tech in the forums.

Second, you can run the Music Server as a service using srvany. Call the service “SBWMSvr” when installing it. You will need to add an additional string value under HKLM\SYSTEM\CurrentControlSet\Services\SBWMSvr\Parameters called AppDirectory pointing to “C:\Program Files\Creative\Shared Files” and set the service to run as an adminsitrative account in order for it to work. This eliminates the need for you to login to the system runing the application (ie. if you have a home server). Be sure to remove the link from your startup menu.

DPM Daily Maintenance Script

We recently completed a project to move over 300 servers from our old backup infrastructure to a brand new disk-based DPM 2007 solution. We have been very pleased with DPM 2007 thus far, but are finding that it required a fair amount of hand holding in the mornings to kick off failed jobs, increase disk allocations, and perform consistency checks. Unfortunately, the DPM console can only be loaded on the DPM server itself, and it cannot connect to a remote DPM server. That means logging in via RDP to each DPM server and addressing the alerts. After a few weeks of doing this by hand, we added them to our SCOM 2007 server which helped consolidate the alerts to a single interface, but we found we could not modify disk allocations via SCOM.

So I sat down and hashed out DPM Daily Maintenance Script. This powershell script will query the database for alerts and addresses the four most common. Replica disk and Recovery Point Volume threshold exceeded, Replica is inconsistent, and Recovery Point creation failed. The script takes 4 optional parameters:

replicaIncreaseRatio – Percentage of existing replica disk size to increase (ie. 1.1 increases by 10%. This is the default if nothing is specified)
scIncreaseRatio –  Percentage of existing recovery point volume size to increase (ie. 1.1 increases by 10%. This is the default if nothing is specified)
replicaIncreaseSize – Fixed value to increase replica disk (ie. 1GB)
scIncreaseSize – Fixed value to increase recovery point volume (ie. 1GB)

The script will first query the database for alerts, and then sorts them alphabetically and by alert type. This means that if a replica became inconsistent because the replica disk threshold was exceeded or if a recovery point creation failed because the recovery point volume threshold was exceeded, the script will increase the size of the volume before re-running the job. Also, for replica disks, the script will actually query the original datasource and resize the replica disk to the current workload’s size plus the ratio or fixed amount specified in the script. This ensures that the replica disk is extended to the proper amount during the first pass in cases where a large amount of data is added to the workload.

We have been running this scripts on 6 DPM servers for about 6 weeks now and I have to say they have virtually eliminated the daily maintenance (I was on vacation for 2 weeks during that time and DPM happily hummed along without any intervention, self-healing twice per day). We still use SCOM to monitor the alerts and are manually checking for replicas that are constantly becoming inconsistent or recovery point creations that are consistently failing and addressing those by hand. We have setup a scheduled task that runs twice per day using the following command line:

C:\Windows\system32\windowspowershell\v1.0\powershell.exe -PSConsoleFile “C:\Program Files\Microsoft DPM\DPM\bin\dpmshell.psc1” -command “.’C:\admin\DailyMaintenance.ps1′” >> C:\admin\DailyMaintenance.log

DailyMaintenance

There are a few 3rd party products that can help with these same alerts, and Microsoft is working on making our lives easier with DPM v3, but in the meantime, this should take some of the burden off of the sys admins.

Partition Alignment

Squeezing every ounce of performance out of your disk array is critical in IO intensive applications. Most times, this is simply an after-thought. However, doing a little leg-work during the implementation phase can go a long way to increasing the performance of your application. Aligning partitions is a great idea for SQL and virtualized environments – these are the places you will see the most benefit.

The concept of aligning partitions is actually quite simple and applies to SAN’s and really any disk array alike. If you are using RAID in any capacity, then aligning disk partitions will help increase performance. It is best illustrated by the following graphics, borrowed from http://www.vmware.com/pdf/esx3_partition_align.pdf (This is a great read, but specific to VMWare environments, however, the same concepts apply).

Using unaligned partitions in a virtual environment, you can see that a read could ultimately result in 3 disks accesses to the underlying disk subsystem:

By aligning partitions properly, that same read results in just 1 disk access:

While these graphics are Virtual Machine and VMWare specific, the same is true for Hyper-V and SQL (except remove the middle layer for SQL). In order for partition alignment to work properly, you need to ensure that the lowest level of the disk sub-system has the highest segment size (also referred to as stripe size). Depending upon your RAID controller or SAN, this could default to as low as 4K or as high as 1024K. I won’t cover what differences in segment sizes mean for performance, that’s an entirely difference discussion, but generally speaking defaults are usually 64K or 128K. The basic idea behind a proper stripe size is that you want to size it so that most of your reads/writes can happen in 1 operation.

From there, you need to ensure that your block or file allocation unit size is set properly – ideally smaller or the same size as the segment size and that it is a multiple of the segment size. Lastly, you should then set the offset to the same as the segment size. By default, Windows 2003 will offset by 31.5K, Windows 2008 by 1024K, and VMWare VMFS default’s to 128.

Setting the segment size may or may not be an online operation – that depends entirely on your RAID controller or SAN as to whether this can be done to an already configured array or if it has to be done during the initial configuration. Changing the offset and/or block size of a partition however is NOT an online operation. This means that all data will have to be removed from the partition, the offset configured, and the partition recreated. Prior to Windows 2008, this cannot be done to system partitions so for Windows 2003, you would have to attach the virtual hard disk to another system, set the offset and format the partition, and then perform the windows installation.

The following links provide detailed information about aligning partitions in both VMWare and Windows. Consult your SAN or RAID controller documentation for setting or finding out the segment size.

Recommendations for Aligning VMFS Partitions

Disk Partition Alignment Best Practices for SQL Server

Closing open file handles

Every now and then we have problems deleting or changing permissions on a file because it is open by a process. However, we often times have trouble finding that process. There is a neat sysinternals (now MS) utility called “handle” that will show you all open handles on a file, and, more importantly, let you close that handle. Below is the syntax of how to find the handle, and close it:

To find the handle:

O:\Tools>handle C:\Test\Example.dll

Handle v3.31
Copyright (C) 1997-2008 Mark Russinovich
Sysinternals – http://www.sysinternals.com/

svchost.exe        pid: 1388    240: C:\Test\Example.dll

The above output shows us the name of the process, the pid, and file handle (in hex) and the file name. If we wanted to see all handles by a particular process, we could use the –p option:

O:\Tools>handle -p 1388

Handle v3.31
Copyright (C) 1997-2008 Mark Russinovich
Sysinternals – http://www.sysinternals.com/

8: File  (—)   C:\WINDOWS\System32
74: File  (—)   C:\WINDOWS\System32\en-US\svchost.exe.mui
194: Section       \BaseNamedObjects\__ComCatalogCache__
198: Section       \BaseNamedObjects\__ComCatalogCache__
1A4: File  (—)   C:\WINDOWS\Registration\R00000000000f.clb
1B0: File  (—)   C:\WINDOWS\System32\en-US\crypt32.dll.mui
1B4: File  (—)   C:\WINDOWS\winsxs\amd64_microsoft.windows.common-controls_6595b64144ccf1df_6.0.6001.18000_none_152e7382f3bd50c6
1C0: File  (—)   C:\WINDOWS\winsxs\amd64_microsoft.windows.common-controls_6595b64144ccf1df_6.0.6001.18000_none_152e7382f3bd50c6
1CC: File  (—)   C:\WINDOWS\System32\inetsrv\config\schema
1D8: File  (—)   C:\WINDOWS\Microsoft.NET\Framework64\v2.0.50727\CONFIG
1DC: File  (—)   C:\WINDOWS\Microsoft.NET\Framework64\v2.0.50727\CONFIG
1E0: File  (—)   C:\WINDOWS\System32\inetsrv\config
1E8: Section       \RPC Control\DSEC56c
1FC: File  (—)   C:\WINDOWS\winsxs\amd64_microsoft.windows.common-controls_6595b64144ccf1df_6.0.6001.18000_none_152e7382f3bd50c6
200: Section       \BaseNamedObjects\windows_shell_global_counters
240: File  (—)   C:\Test\Example.dll
264: File  (—)   C:\WINDOWS\System32\en-US\kernel32.dll.mui
284: File  (—)   C:\WINDOWS\System32\inetsrv\config

This happens to be a Windows 2008 box, so I can take it one step further and find the service via task manager:

Process

Since we need to delete or change this file and windows is not allowing me to since it is locked by the FTP service, I can forcefully close the handle by specifying the handle and pid (*Note: This should be used with care as it can cause the process to crash. Consider using this as a last resort instead of restarting a service or rebooting to free the lock):

O:\Tools>handle -c 240 -p 1388

Handle v3.31
Copyright (C) 1997-2008 Mark Russinovich
Sysinternals – http://www.sysinternals.com/

240: File  (—)   C:\Test\Example.dll
Close handle 240 in svchost.exe (PID 1388)? (y/n) y

Handle closed.

The file can now be modified/deleted.

Using IIS Debug Diagnostics to troubleshoot Worker Process CPU usage in II6

Failed request tracing in IIS7 can help track down many performance issues with websites, but we still have a broad customer base on IIS6. Troubleshooting performance issues in IIS6 has been quite difficult until Microsoft released a set of tools that gave greater insight into analyzing a stack trace.

The IIS Debug Diagnostics Tool can help track down CPU and memory issues from a worker process. Microsoft has a nice kb article that goes over the basics as well: http://support.microsoft.com/kb/919791.

1. Install the IIS Debug Diagnostics locally on the system.

2. Open the Debug Diagnostics Tool under Start > Programs > IIS Diagnostics > Debug Diagnostics Tool > Debug Diagnostics Tool.

3. Click Tools > Options And Settings > Performance Log tab. Select the Enable Performance Counter Data Logging option. Click OK.

4. Use task manager to find the PID of the worker process.

5. Select the Processes tab and find the process in the list.

6. Right-click on the process and select Create Full Userdump. This will take a few minutes and a box will pop-up giving you the path to the dump file.

7. Select the Advanced Analysis tab and click the Add Data Files button. Browse to the dump file that was jump created and click OK.

8. Select Crash/Hang Analyzers from the Available Analysis Scripts box for CPU Performance and crash analysis. Click Start Analysis.

After a few minutes, a report should be generated containing stack trace information as well as information about any requests executing for longer than 90 seconds. Note that the memory dump with use a few hundred megabytes of space, so be sure to install the tool on a drive with sufficient debugging space. Also, if the box is under heavy load, you can create the user dump on the system, copy the file to your workstation, and perform the analysis locally.

IIS6: 404 Error serving content with .com in URL

We ran into an issue today where a customer was having problems serving content from a folder named “example.com”. IIS6 was simply returning a 404 error. I immediately suspected something like URLScan but I eventually found it was due to the execute permissions configured on the parent virtual directory. When the customer configured the virtual directory, they set the execute permissions to “Scripts and executables”. This means that IIS will try to run any cgi compliant executables (.com and .exe files by default) in the virtual directory. In order to run the application, the executable also needs to be authorized in Web Service Extensions.

However, in this case, the URL simply contained “example.com” in the URL: http://server/example.com/images/image1.jpg and we were not trying to run an application. IIS was seeing the “example.com” in the URL and assuming it was a cgi executable and attempting to run the application. However, the file “example.com” did not exist and was therefore returning a 404 error. To correct the issue, we simply set the execute permissions to “None” since the customer was attempting to serve static content, though you can also use “Scripts only”.

The key to this is that there does not need to be a specifc mapping for executables. IIS 6 will attempt to run any executable if the vdir is configured with “Scripts and executables” permissions.

Calculating disk usage and capacity using Diskmon

While evaluating SAN storage solutions for our VMWare environment, we found ourselves asking the question “How many systems can we fit on this system before IOPs and/or throughput become a bottleneck?” Come to find out, the answer is not a simple one. In fact, all of the vendors we posed this question to were only able to give us vauge performance numbers based on perfect conditions. We set out on a quest to quantify the capacity of each of the backend storage systems we tested.

Generally speaking IOPs is inversely proportional to the request size while throughput is proportional. This means that as the request size descreases the total number of IOPs increases while throughput decreases and vice versa. So when you see performance numbers that claim very high IOPs those are based on small requests and therefore throughput will be very minimal. In additional, disk latency and rotational speed can play a role in skewing these numbers as well. Sequential operations will produce much higher numbers than random operations. When we add RAID to the equation, we will see a difference in numbers depending upon whether the operation is a read or a write.

What does all this mean? It means that the performance capacity of a disk or storage device is determined by 3 main factors: Request Size, Random/Sequential operation, and Read/Write operation. There are other factors that can play a role, but focusing on these three factores will provide an estimation of the capacity of a disk, array or storage system. There are differing opinions as to what these numbers are in “real life.” The generally accepted view is that the average request size is 32K, 60% of transactions are random while 40% are sequential, and 65% are reads while 35% are writes. However, these numbers differ depending upon the application. The best way to determine these numbers for your environment is to capture statistics from production systems and average them together.

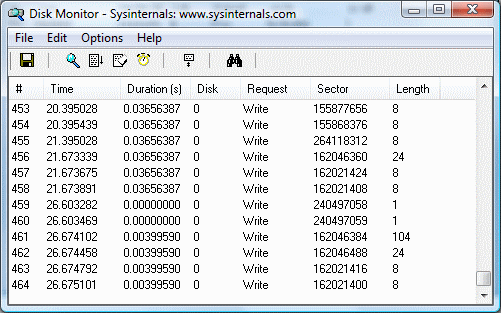
Fortunately, there is a nice utility for Windows that will allow you to get this information. The Diskmon utility: http://technet.microsoft.com/en-us/sysinternals/bb896646.aspx available from SysInternals (now part of Microsoft), will log every disk transaction with the necessary information.

Diskmon from SysInternals (now Microsoft)

Diskmon will begin capturing data immediately. To stop Diskmon from capturing data, click the magnifying glass in the toolbar:

Stop capture

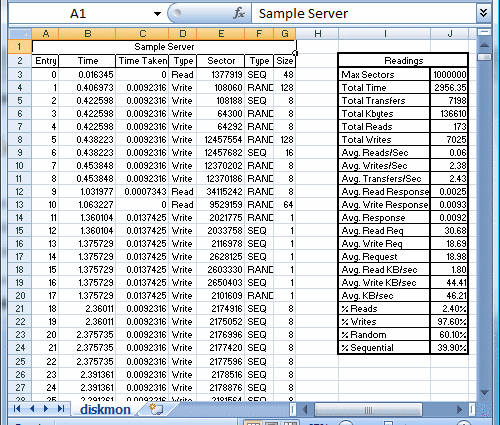
You can then save the output to a text file by clicking the save button. I recommend capturing data during normal usage over a reasonable period of time. Also, it is best to minimize the Diskmon window to keep CPU usage to a minimum. The next step is to import the text file into Excel. I have provided a sample excel spreadsheet you can use as a template to perform the necessary calculations: server_diskmon.

Diskmon output to Excel spreadsheet

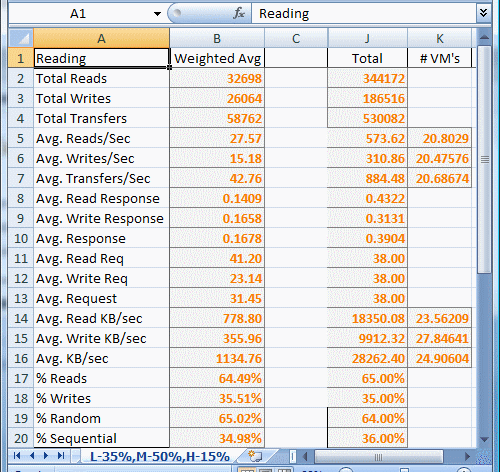
By taking a sampling from various systems on our network and using a weighted average, we calculated average of usage on our systems. In our case, we were using a common storage backend, and we wanted to categorize different systems into low (L), medium (M), and high (H) usage systems. We then assigned a percentage to each. By doing this, we can calculate the disk usage on the system if x% are low usage, y% medium usage, and z% high usage.

Weighted average of several systems on our network

We now have an accurate estimation of the Read Request Size, Random/Sequential percentages, and Read/Write percentages. If we feed these numbers into IOMeter, we can get a baseline of what the backend storage system can support. Divide that by our weighted average and we can find exactly how many systems our backend can support. If we look at point in time numbers, we can figure out the percentage of disk capacity being used:

Capacity of storage backend

I have put together a sample IOMeter configuration file containing the “real life” specification of 32K requests, 60% Random / 40% Sequential, and 65% Reads / 35% Writes.

Also, there’s a great comparison of SAN backends for VMWare environments here: http://communities.vmware.com/message/584154. Users have run the same real life test against their backend storage systems which will allow you to compare your devices performance with other vendors.

One side note when using IOMeter, be sure to set your disk size to something greater than the amount of cache in your backend storage systems in order to calculate raw disk performance. The configuration file I have provided uses a 8GB test file which should suffice for most installations.

SQL Server Authentication Channnel Encryption

We had a customer recently inquire as to whether the authentication channel between a client and a SQL Server was encrypted by default. While we know that SSL is supported on SQL Server 2005, we did not have a certificate installed. However, it was rumored that the system would use a self-signed certificate. Also, we wanted to explore the differences between SQL Server 2000 and SQL Server 2005, as well as the differences between different providers.

I searched for documentation confirming that the authentication channel was indeed encrypted and was able to come up with the following from this MSDN article: http://msdn2.microsoft.com/en-us/library/ms189067.aspx

“Microsoft SQL Server 2005 can use Secure Sockets Layer (SSL) to encrypt data that is transmitted across a network between an instance of SQL Server and a client application. The SSL encryption is performed within the protocol layer and is available to all SQL Server clients except DB Library and MDAC 2.53 clients.”

“Credentials (in the login packet) that are transmitted when a client application connects to SQL Server 2005 are always encrypted. SQL Server will use a certificate from a trusted certification authority if available. If a trusted certificate is not installed, SQL Server will generate a self-signed certificate when the instance is started, and use the self-signed certificate to encrypt the credentials. This self-signed certificate helps increase security but it does not provide protection against identity spoofing by the server. If the self-signed certificate is used, and the value of the ForceEncryption option is set to Yes, all data transmitted across a network between SQL Server and the client application will be encrypted using the self-signed certificate.”

Well, this contradicted some posts I had read but did point us in the right direction. So, we decided to test this. I setup two Virtual Machines, one running a .NET web application and a .NET windows application, and one running SQL Server 2005 Express Edition. I then installed Network Monitor 3.1 and captured the traffic on the NIC as we tested the connection using the SQL Native Client (SQLNCLI) and OLEDB (System.Data.SqlClient).

We saw the server send a self-signed certificate to the client and after which, the authentication channel was encrypted. We also ran the same test on SQL Server 2000. While the authentication channel is not encrypted with SQL Server 2000, the password is not sent in clear text. Rather, it appears obfuscated – most likely using an offset of some kind. We did see the username come across in clear text.

To summarize, when using SQL Server 2005, the authentication channel is completely encrypted when using any clients except DB Library and MDAC 2.53 clients regardless of whether the server has a SSL certificate installed.